Microsoft FabricPySparkData FactoryPower BIMedallion Architecture
An end-to-end automated data pipeline in Microsoft Fabric transforming earthquake data from the USGS API into actionable insights using PySpark, Data Factory, and Power BI.
PythonAPI IntegrationETL PipelineShopify GraphQLPower BI
A robust end-to-end data pipeline integrating Bsale, Shopify, and marketplace sales into a unified model for advanced sales and inventory analytics in Power BI.
Full ETL pipeline in Python and snowflake-style data model for Power BI, analyzing the global prevalence and burden of mental health disorders. Includes tooltips, bookmarks, slicers, and rich storytelling visuals.
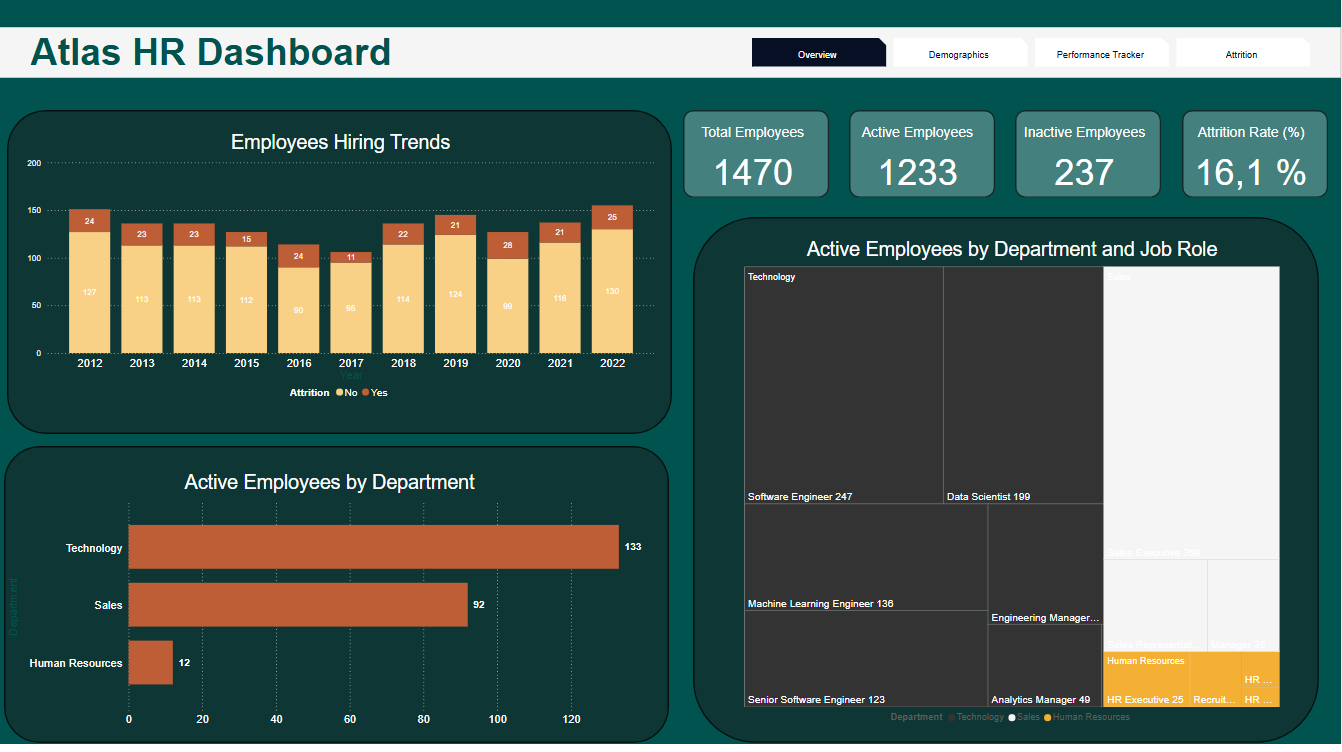
Interactive dashboard using HR data to analyze turnover rates, salary distribution, and gender gaps. Built with Power BI and DAX for insightful business decisions.